Easily anonymize your data
Let’s imagine two scenarios:
- You’re hiring consultants to work on your data but need to anonymize it first
- You created something great that you want to make into a template for other people who can’t see the data
How would you personally go about solving this?
Anonymize df
I’ve been confronted with these scenarios multiple times and had a very ad hoc, quick and dirty, kind of approach to it. Starting from scratch every time, which meant saving time in the short run but losing time and quality in the long run.
When a colleague asked how complicated it would be to make a general-purpose tool for this kind of process, I saw that as an opportunity to finally do something about this and create a project for my public portfolio that is quite useful.
The result being Anonymize df, which is a python package and Alteryx macro that helps you quickly and easily generate realistically fake data from a Pandas DataFrame.
Where to get it
You can install it like you would any other package through pip:
pip install anonymizedfYou can also find it here:
Python usage
import pandas as pd
from anonymizedf.anonymizedf import anonymize

Import the data
df = pd.read_csv("https://query.data.world/s/shcktxndtu3ojonm46tb5udlz7sp3e")

Prepare the data to be anonymized
an = anonymize(df)
Example 1 - just updates df
an.fake_names("Customer Name")
an.fake_ids("Customer ID")
an.fake_whole_numbers("Loyalty Reward Points")
an.fake_categories("Segment")
an.fake_dates("Date")
an.fake_decimal_numbers("Fraction")
df.head()| Customer ID | Customer Name | Loyalty Reward Points | Segment | Date | Fraction | Fake_Customer Name | Fake_Customer ID | Fake_Loyalty Reward Points | Fake_Segment | Fake_Date | Fake_Fraction | |
| 0 | AA-10315 | Alex Avila | 76 | Consumer | 01/01/2000 | 7.6 | Anne Briggs | FYKP18464993584790 | 715 | Segment 1 | 1988-02-21 | 81.70 |
| 1 | AA-10375 | Allen Armold | 369 | Consumer | 02/01/2000 | 36.9 | Kathryn Poole-Owens | KQLT34683822176548 | 305 | Segment 1 | 2012-01-21 | 49.64 |
| 2 | AA-10480 | Andrew Allen | 162 | Consumer | 03/01/2000 | 16.2 | Dorothy Knight-Smith | KEKQ23089097589905 | 723 | Segment 1 | 2017-12-05 | 45.49 |
| 3 | AA-10645 | Anna Andreadi | 803 | Consumer | 04/01/2000 | 80.3 | Dr. Dennis Lowe | JUFR80046496812327 | 503 | Segment 1 | 1993-08-19 | 43.85 |
| 4 | AB-10015 | Aaron Bergman | 935 | Consumer | 05/01/2000 | 93.5 | Joan Read | ZLEK68784141425071 | 103 | Segment 1 | 2018-10-26 | 65.30 |
Example 2 - method chaining
fake_df = (
    an
    .fake_names("Customer Name", chaining=True)
    .fake_ids("Customer ID", chaining=True)
    .fake_whole_numbers("Loyalty Reward Points", chaining=True)
    .fake_categories("Segment", chaining=True)
    .fake_dates("Date", chaining=True)
    .fake_decimal_numbers("Fraction", chaining=True)
    .show_data_frame()
)
fake_df.head()| Customer ID | Customer Name | Loyalty Reward Points | Segment | Date | Fraction | Fake_Customer Name | Fake_Customer ID | Fake_Loyalty Reward Points | Fake_Segment | Fake_Date | Fake_Fraction | |
| 0 | AA-10315 | Alex Avila | 76 | Consumer | 01/01/2000 | 7.6 | Matthew Elliott | KQPQ33621304584922 | 62 | Segment 1 | 2011-05-24 | 96.96 |
| 1 | AA-10375 | Allen Armold | 369 | Consumer | 02/01/2000 | 36.9 | Lynne Harding | CLAA15849783691822 | 494 | Segment 1 | 2000-10-14 | 20.78 |
| 2 | AA-10480 | Andrew Allen | 162 | Consumer | 03/01/2000 | 16.2 | Dr. Molly Holmes | VTWU51877283324210 | 383 | Segment 1 | 1994-01-30 | 66.87 |
| 3 | AA-10645 | Anna Andreadi | 803 | Consumer | 04/01/2000 | 80.3 | Mr. Frederick Price | MVFX95041828905565 | 82 | Segment 1 | 2000-01-11 | 25.77 |
| 4 | AB-10015 | Aaron Bergman | 935 | Consumer | 05/01/2000 | 93.5 | Dean Davies | CRXZ11641101775380 | 786 | Segment 1 | 1996-08-19 | 38.32 |
Example 4 - for multiple columns

column_list = ["Segment", "Customer Name", "Customer ID", "Date"]

for column in column_list:
     an.fake_categories(column)
df.head()| Customer ID | Customer Name | Loyalty Reward Points | Segment | Date | Fraction | Fake_Customer Name | Fake_Customer ID | Fake_Loyalty Reward Points | Fake_Segment | Fake_Date | Fake_Fraction | |
| 0 | AA-10315 | Alex Avila | 76 | Consumer | 01/01/2000 | 7.6 | Customer Name 1 | Customer ID 1 | 62 | Segment 1 | Date 1 | 96.96 |
| 1 | AA-10375 | Allen Armold | 369 | Consumer | 02/01/2000 | 36.9 | Customer Name 2 | Customer ID 2 | 494 | Segment 1 | Date 2 | 20.78 |
| 2 | AA-10480 | Andrew Allen | 162 | Consumer | 03/01/2000 | 16.2 | Customer Name 3 | Customer ID 3 | 383 | Segment 1 | Date 3 | 66.87 |
| 3 | AA-10645 | Anna Andreadi | 803 | Consumer | 04/01/2000 | 80.3 | Customer Name 4 | Customer ID 4 | 82 | Segment 1 | Date 4 | 25.77 |
| 4 | AB-10015 | Aaron Bergman | 935 | Consumer | 05/01/2000 | 93.5 | Customer Name 5 | Customer ID 5 | 786 | Segment 1 | Date 5 | 38.32 |
Example 5 - grouping

d2 = {"category": ["low", "low", "high", "high"], "number": [0.1, 1, 10.1, 100.1]}
df2 = pd.DataFrame(data=d2)

an = anonymize(df2)
df2.head()| category | number | |
| 0 | low | 0.1 |
| 1 | low | 1.0 |
| 2 | high | 10.1 |
| 3 | high | 100.1 |
Without grouping - relative relationships lost when generating fake data
an.fake_decimal_numbers("number")
df2.head()| category | number | Fake_number | |
| 0 | low | 0.1 | 86.03 |
| 1 | low | 1.0 | 64.72 |
| 2 | high | 10.1 | 68.66 |
| 3 | high | 100.1 | 13.41 |
With grouping - relative relationships remain the same
an.fake_decimal_numbers("number", "category")
df2.head()| category | number | Fake_number | |
| 0 | low | 0.1 | 0.38 |
| 1 | low | 1.0 | 0.92 |
| 2 | high | 10.1 | 63.70 |
| 3 | high | 100.1 | 59.40 |
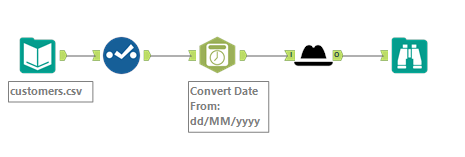
Alteryx usage
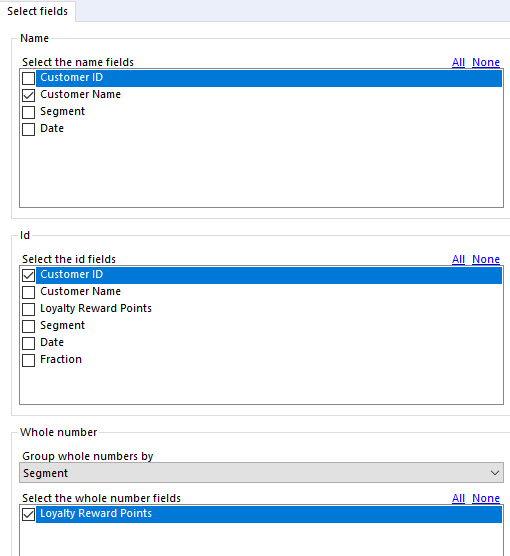
The Macro can be downloaded from the gallery and used just like any other macro

The interface for using the macro should be quite straightforward, if not let me know ;)

If you have any thoughts / comments feel free to let me know
Also let me know if you’d be interested in a “behind the scenes” post / video about how this was created.